
Specialty Care VBC
Pricing the Risk We’re Actually Trading
Value‑based care contracting is fundamentally a transfer of risk. Any care‑delivery organization that takes responsibility for outcomes and costs has to think beyond its expected impact on the population and make sure it is compensated for the risk premium it absorbs. That premium matters most in specialty care, where organizations manage smaller cohorts and heavily skewed cost distributions with higher variance, skewness, and kurtosis than broader populations. In what follows, I explain why transferring specialty‑care risk creates real value for health plans and other risk‑bearing entities, and I sketch a practical way to price that transfer beyond the mean.
What is different about Specialty Care?
Early VBC waves focused on primary care—for good reasons. Primary care offers frequent touchpoints that shape downstream utilization, and PCP panels are large and heterogeneous. Because those panels are effectively random samples of the total book, they tend to behave like the overall population on average. In that context, it made sense to emphasize contracts and ROI stories that target the mean: design an intervention, lower average cost, and use those savings to fund operations and share value.
If we’re serious about bending the cost curve, we have to bring that same discipline into specialty populations. In 2023, direct specialty spending in orthopedics, oncology, cardiology, women’s health, behavioral health, and nephrology accounted for 38% of total medical spending, and the total cost of care for people seeing specialists in those six areas accounted for 68% of commercial and Medicare spending. That is where the curve is steepest, and that is where the work must happen. Policy and capital are already shifting: the CMS Innovation Center has launched more than a dozen specialty‑focused models over the past decade and, in its 2025 strategy, called for expansion across Medicare Advantage and Medicaid with greater participation from independent specialists; private investors put more than $63B into specialty‑enablement companies in 2023. (Source: McKinsey; see Appendix.)
Yet only a small share of specialty care is delivered under risk‑bearing VBC. A major reason: we lack transparent, standard contract structures that move the right risks to the right party and pay specialty organizations appropriately. Copying primary‑care templates rarely works—specialty panels are smaller and their costs are dominated by tail events.
A short actuarial literature
Finance and insurance judge performance relative to risk, not only by expected return or expected cost. In markets that shows up as Sharpe/Sortino ratios (returns over volatility or downside volatility). In (re)insurance and health finance, we codify the same idea with tail‑sensitive measures and risk margins—we ask how bad the bad years get, quantify the capital needed for those years, and put a price on shifting that burden.
The most influential tool here is Expected Shortfall (ES)—also called Tail Value‑at‑Risk (TVaR). Where VaR identifies a cutoff (e.g., the 95th or 99.5th percentile), ES/TVaR averages the outcomes beyond that cutoff—the mean of the worst 5 (or 0.5) percent of years. ES is coherent (it behaves well under diversification) and is preferred when tails drive the story. Modern solvency frameworks operationalize this by translating tail capital into a risk margin with a cost‑of‑capital (CoC) charge (e.g., Solvency II’s published CoC; the Swiss Solvency Test builds capital directly on ES). The same logic carries neatly into payer–vendor contracts.
There are adjacent pricing principles worth knowing. Distortion (Choquet) premiums—like the Wang transform—tilt probabilities to put more weight in the tail and then take a distorted expectation; they’re practical as a sensitivity for non‑traded healthcare risks. Utility‑based approaches (e.g., the exponential premium and Esscher transforms) tilt the loss distribution according to risk aversion and capture more than variance—useful for cross‑checking how a different risk appetite would price the same layer.
The same ideas in health plan CFO/executive language
Think of risk‑adjusted pricing as a straight translation of a budget stress test into a PMPM.
Define the exposure you’re moving. Decide what the vendor will hold: either all specialty costs (a full carve‑out) or a risk corridor. In our simulation we use a dynamic corridor where, each year, the vendor holds the per‑member layer from the 5th to the 95th percentile of the specialty distribution. That removes “everyday big losses” while leaving very low and very high costs with the plan.
Measure how bad the bad years are. Compute ES/TVaR at a chosen confidence (e.g., 95% or 99%). ES answers: “If next year lands in the worst 5 (or 1) out of 100 years for this layer, what is the average dollar loss?” The difference TVaR − Expected is the tail capital the vendor must be able to carry.
Put a price on that capital. Apply a CoC to tail capital to get a risk margin. This mirrors solvency practice and turns “less tail for the payer” into a transparent dollar amount.
Build the vendor’s PMPM.
Vendor price (annual) = E[layer loss] +Admin + CoC (TVaRq-E[layer loss])
Divide by 12 x covered lives to get PMPM. You’re paying for three things: expected costs in the layer, operating expense, and the capital the vendor must hold to absorb bad‑year losses. That capital relief is why the payer’s results become steadier and risk‑adjusted return improves.
Use contract shape to control how much risk you move. A full carve‑out replaces a jagged, tail‑heavy specialty spend with a fixed payment, collapsing variance, skewness, kurtosis, and tail capital. A corridor trims the middle but keeps the super‑tail, so tail capital falls partially, not fully—hence the lower price.
A numerical example: PCP lens vs Specialty Care lens
Consider a population of 100,000 members. Annual costs are log‑normal—realistic for skewed medical spend. Ninety percent belong to a general cohort with a mean of $7,500 PMPY; ten percent belong to a specialty cohort with a mean of $120,000 PMPY and much heavier tails.
A per‑member distribution plot makes the contrast obvious. A PCP carve‑out that manages a random 10% panel behaves like the overall population (a random slice of the book). A specialty carve‑out concentrates the right‑tail of the distribution—exactly the costs that make plan‑level results volatile.
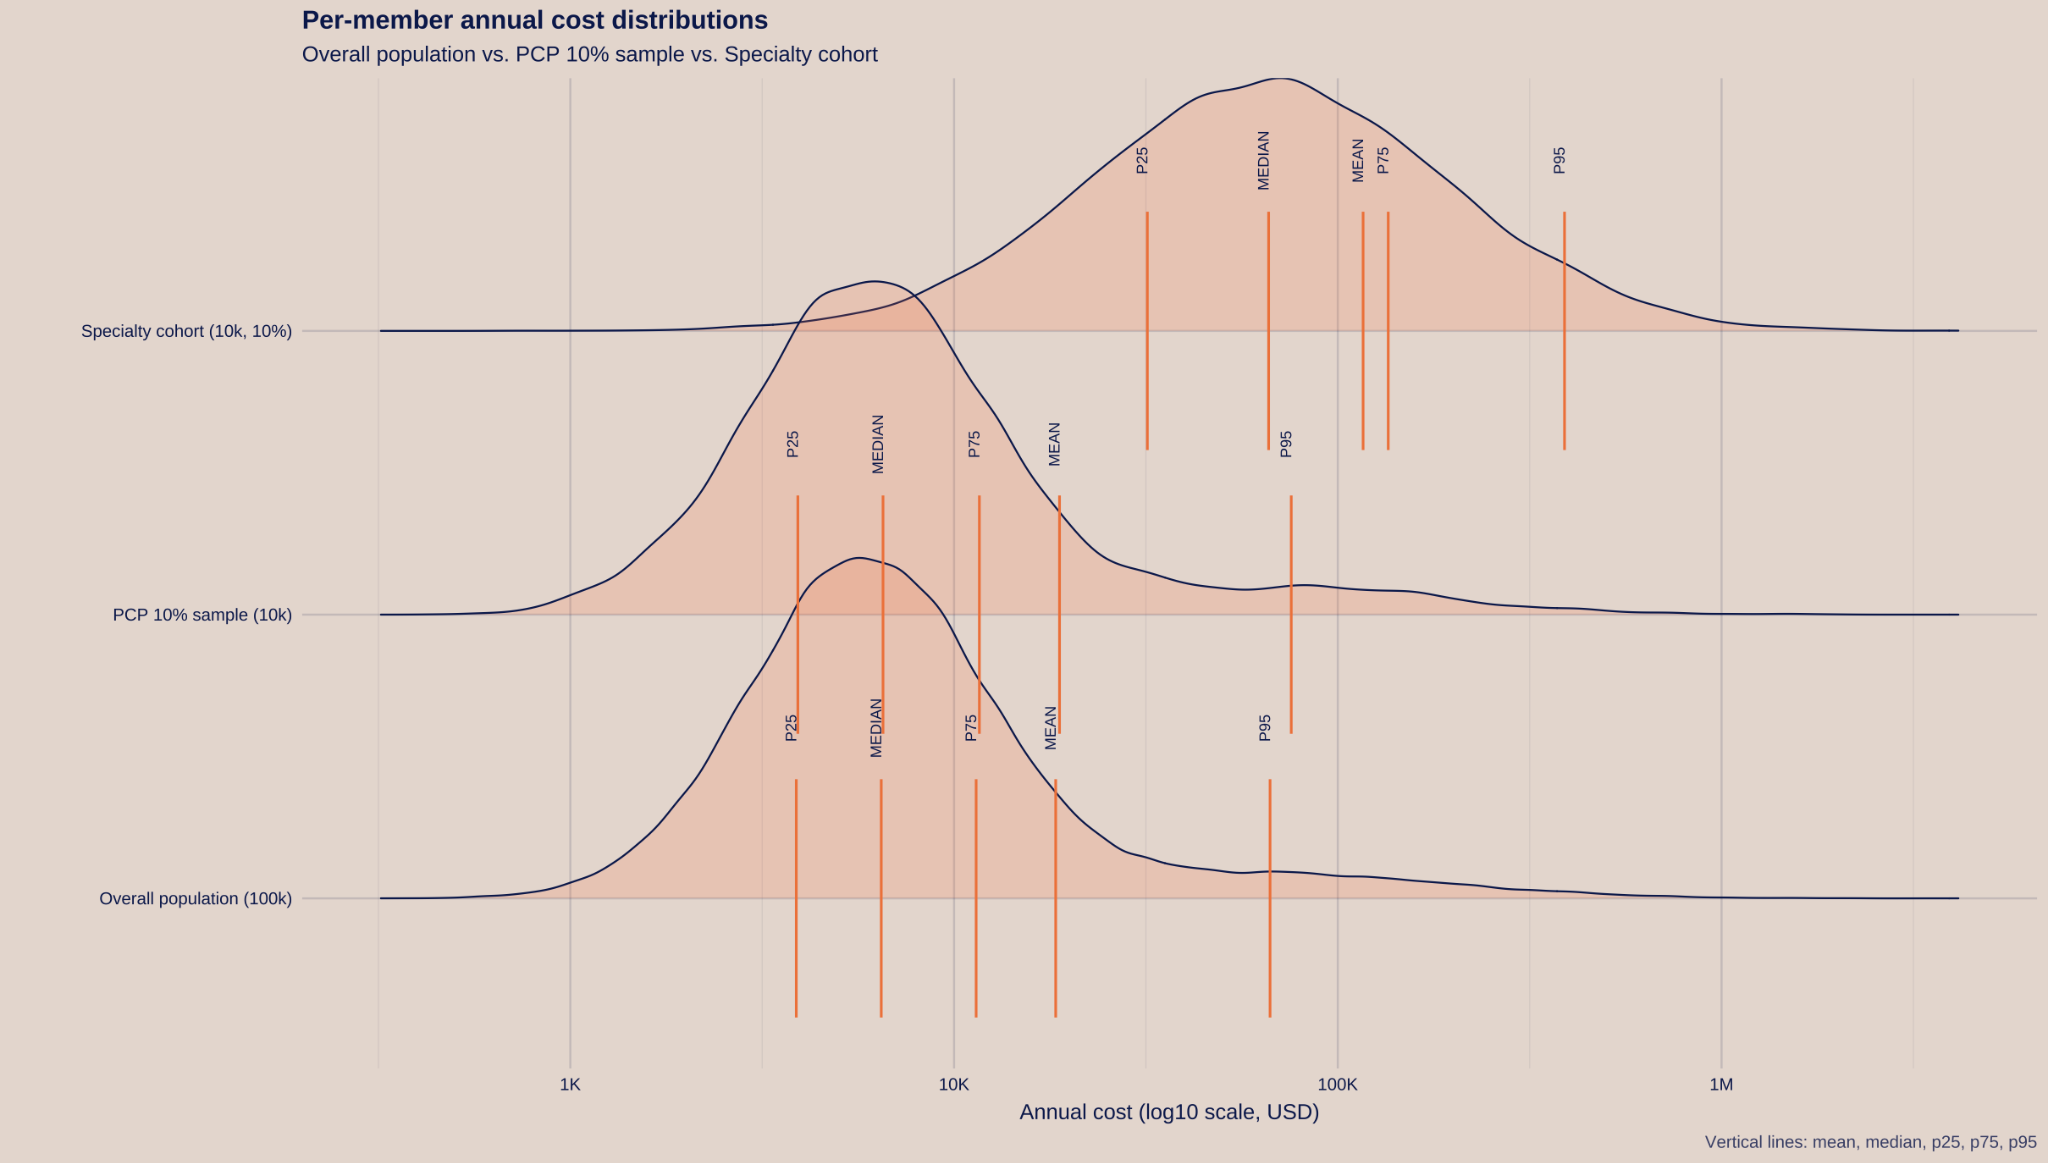
Fig 1: Visualization of the difference of a PCP cohort carve out vs the Specialty Care cohort carve out.
We repeat the simulation 2,000 times as a simple bootstrap. You could compute many of these statistics analytically under independence assumptions, but the bootstrap and visuals resonate with a broader audience.
In the summary table, two things stand out. First, the whole population and PCP 10% cohorts have nearly identical average per‑member costs; the PCP panel just has a larger standard error because it’s smaller. Second, when you remove the specialty cohort, you not only lower the average per‑member cost but also make the tail (p75/p95) far more predictable—exactly the point of moving higher moments off the payer’s books.
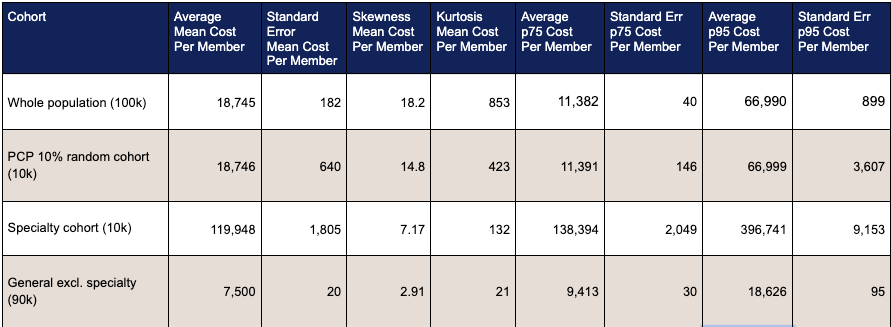
Table 1: Summary statistics from the bootstrapping exercise Summary statistics from the bootstrapping exercise.
Value of risk transfer
We then compare the payer’s retained exposure (claims only) under three scenarios: no contract, full carve‑out, and a p5–p95 corridor on the specialty cohort.
Both risk transfers reduce the plan’s exposure, but the full carve‑out delivers the largest drop in standard deviation and tail capital (TVaR − mean).
The p5–p95 corridor narrows volatility in the middle of the distribution yet leaves the super‑tail with the plan, so tail capital falls meaningfully but not maximally.
Using TVaR at 95%, a CoC of 8%, and $30 PMPM admin on the full book, the pricing equation cleanly decomposes into expected layer loss, risk margin (CoC × tail capital), and admin. That transparency lets plans decide how much capital relief they want to buy, and lets vendors decide how much risk is appropriate for their balance sheet.
Sidebar: Because specialty VBC is still early, the cost of capital for care‑delivery vendors is often higher than for large payers. That reality makes corridors an attractive on‑ramp: material stabilization for the plan at a price that’s feasible for vendor capital stacks.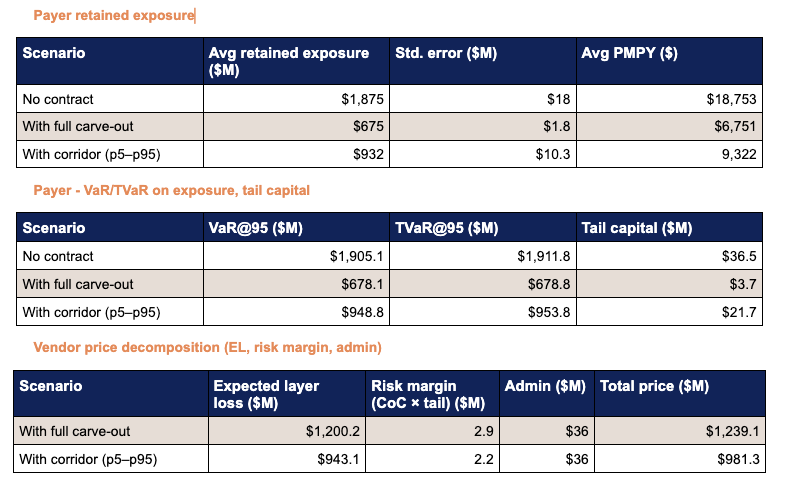
Closing Thoughts: Pricing the Risk We’re Actually Trading
If specialty value‑based care is going to scale, we have to price the risk we’re actually trading. Payers don’t just benefit from lower average costs—they buy stability. Every time a specialty vendor assumes downside exposure, the payer’s variance, skewness, and tail risk shrink. That capital relief has enterprise value and deserves to be priced explicitly.
Vendors that shoulder specialty tails should be compensated for the higher‑moment risk they absorb, not just the mean they manage. An actuarial toolkit can be formally built out to commoditize the pricing and transfer of risk: TVaR‑based risk margins to value tail capital, and distortion‑premium sensitivities to reflect different appetites for tail risk.
This article is a conversation starter, not a full model; it intentionally sets aside messy real‑world complications—new therapies, market entry waves, legislation, and data lags. But the direction is clear: if we want specialty VBC to move from pilots to system‑level impact, we need to price risk transfer so the organizations holding it are appropriately compensated for the capital, volatility, and uncertainty they take on.
Appendix
Key sources to link for readers who want to go deeper